Monitoring with Ganglia
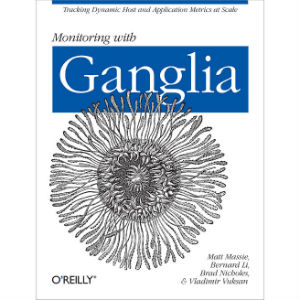
Written by Ganglia designers and maintainers, this book shows you how to collect and visualize metrics from clusters, grids, and cloud infrastructures at any scale. Want to track CPU utilization from 20,000 hosts every ten seconds? Ganglia is just the tool you need, once you know how its main components work together. This hands-on book helps experienced system administrators take advantage of Ganglia 3.x.
Learn how to extend the base set of metrics you collect, fetch current values, see aggregate views of metrics, and observe time-series trends in your data. You’ll also examine real-world case studies of Ganglia installs that feature challenging monitoring requirements.
- Determine whether Ganglia is a good fit for your environment
- Learn how Ganglia’s gmond and gmetad daemons build a metric collection overlay
- Plan for scalability early in your Ganglia deployment, with valuable tips and advice
- Take data visualization to a new level with gweb, Ganglia’s web frontend
- Write plugins to extend gmond’s metric-collection capability
- Troubleshoot issues you may encounter with a Ganglia installation
- Integrate Ganglia with the sFlow and Nagios monitoring systems
Contributors include: Robert Alexander, Jeff Buchbinder, Frederiko Costa, Alex Dean, Dave Josephsen, Peter Phaal, and Daniel Pocock.
Table of Contents
Chapter 1. Introducing Ganglia
Chapter 2. Installing and Configuring Ganglia
Chapter 3. Scalability
Chapter 4. The Ganglia Web Interface
Chapter 5. Managing and Extending Metrics
Chapter 6. Troubleshooting Ganglia
Chapter 7. Ganglia and Nagios
Chapter 8. Ganglia and sFlow
Chapter 9. Ganglia Case Studies
Appendix A. Advanced Metric Configuration and Debugging
Appendix B. Ganglia and Hadoop/HBase
Book Details
- Paperback: 256 pages
- Publisher: O’Reilly Media (November 2012)
- Language: English
- ISBN-10: 1449329705
- ISBN-13: 978-1449329709


